Introduction
When we have an image, it is always taken as a 2D matrix. The size of the image is nothing but the dimension of the matrix.
Credits of Cover Image - Photo by Kai Krog Halse on Unplash
In Python when we read the image, the size can be easily found by the .shape method. In order to find the shape, we should first read the image and obtain the matrix.
Let's first implement for a 2D matrix or array and then replicate the same for images.
Finding Size of a Matrix
First, we are creating a matrix using the module NumPy. The code for the same can be seen below.
>>> import random
>>> import numpy as np
>>>
>>> mat = np.array([
...     [random.randint(10, 100) for i in range(5)] for j in range(5)
... ])
>>>
>>> print(mat)
[[ 30  91  12  44  52]
 [ 37  72  19 100  77]
 [ 94  77  60  48  64]
 [ 65  26  59  52  40]
 [ 37  58  13  74  36]]
>>>
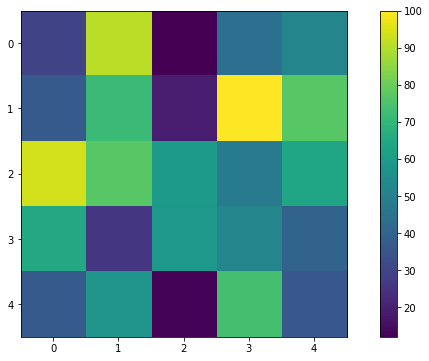
We will use the method .shape to find out the dimension of the matrix. Clearly, the matrix has 5 rows and 5 columns.
>>> dimension = mat.shape
>>>
>>> print(dimension)
(5, 5)
>>>
If we plot the same, we will get the matrix image as below.
>>> import matplotlib.pyplot as plt
>>>
>>> plt.figure(figsize=(12, 6))
<Figure size 1200x600 with 0 Axes>
>>> mat_plot = plt.imshow(mat)
>>> plt.colorbar(mat_plot)
<matplotlib.colorbar.Colorbar object at 0x0AF04418>
>>> plt.show()
>>>

Size Manipulation of the Matrix
We can increase the size by using the interpolation technique. In mathematics, interpolation is a type of estimation to construct new data points within the range of a discrete set of known data points.
Let's create a function that will resize the given matrix and returns a new matrix with the new shape.
def resize_image(image_matrix, nh, nw):
    if len(image_matrix.shape) == 3:
        oh, ow, _ = image_matrix.shape
    else:
        oh, ow = image_matrix.shape

    re_image_matrix = np.array([
        np.array([image_matrix[(oh*h // nh)][(ow*w // nw)] for w in range(nw)])
        for h in range(nh)
    ])

    return re_image_matrix
Credits of the above code - NumPy scaling the Image.
Function Breakdown
We are passing three arguments -
image_matrix→ Basically any matrix that we want to change the dimension.nh→ New height (goes row-wise).nw→ New width (goes column-wise).
In the function, we are taking old height (oh) and old width (ow) according to the length of the image matrix's shape. The shape of the image varies for the colored image and grayscale image.
Also, we have 2 for loops for 2 levels (row-wise and column-wise) and performing an integer division for each iterative in the range of new height and new width. This will decide the index for which the element is extracted from the matrix.
Let's increase the matrix size where the new matrix should have 8 rows and 8 columns.
>>> re_mat = resize_image(image_matrix=mat, nh=8, nw=8)
>>> print(re_mat)
[[ 30  30  91  91  12  44  44  52]
 [ 30  30  91  91  12  44  44  52]
 [ 37  37  72  72  19 100 100  77]
 [ 37  37  72  72  19 100 100  77]
 [ 94  94  77  77  60  48  48  64]
 [ 65  65  26  26  59  52  52  40]
 [ 65  65  26  26  59  52  52  40]
 [ 37  37  58  58  13  74  74  36]]
>>>
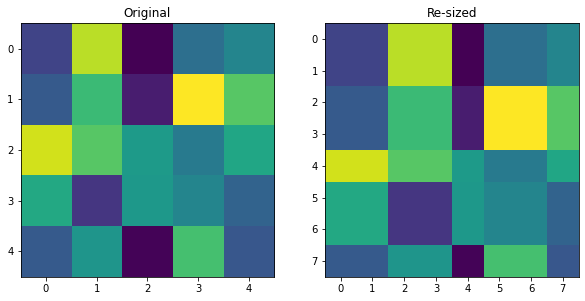
We can clearly see, the new matrix re_mat is bigger than the original matrix mat. The dimension of the re_mat is 8x8. If we were to visualize the same, there won't any particular difference between the original matrix plot and the new matrix plot.
>>> fig, (ax1, ax2) = plt.subplots(nrows=1, ncols=2, figsize=(10, 20))
>>>
>>> ax1.title.set_text('Original')
>>> ax2.title.set_text("Re-sized")
>>>
>>> ax1.imshow(mat)
>>> ax2.imshow(re_mat)
>>> plt.show()
>>>

We can notice the difference in the axis scaling. The second image is more scaled than the first image. The resizing is handled with care to retain the pixel values. The same thing is applied to the image for increasing and decreasing the size respectively.
Note - We can use the OpenCV's resizing techniques. I wanted to learn how we can do the same from scratch.