
Introduction
In this article, we will try to understand the inner working of cv2.rectangle() using the NumPy module in Python.
Credits of Cover Image - Photo by Tim Mossholder on Unsplash
The cv2.rectangle() is OpenCV’s method — used to draw a rectangle on the image. We have options to decide the thickness and the color of the rectangle. But we need to make sure that the color is passed as the RGB code (R, G, B). With this, blog article we will try to focus on understanding the inner working of this method and implement the same from scratch using the NumPy module.
A rectangle is simply a shape that we would like to draw on an image in the specified position. We can have the position to draw by passing two points pt1 and pt2. The image matrix is considered as a 2D plane for us to decide the position of the rectangle. Let’s understand the library method first.
The arguments of the above-mentioned method are:
img→ Image on which the rectangle is drawn.pt1→ Point 1 to decide the position of the rectangle.pt2→ Point 2 also to decide the position of the rectangle.color→ Color of the rectangle which is passed as RGB code.thickness→ The line thickness of the rectangle.
Other arguments and their importance can be learned by checking help(cv2.rectangle). First, we will implement the library method and then we will implement the code from scratch.
Time to Code
The packages that we mainly use are:
- NumPy
- Matplotlib
- OpenCV → It is only used for reading the image (in this article).
Import the Packages
import numpy as np
import cv2
import json
from matplotlib import pyplot as plt
Read the Image
def read_this(image_file, gray_scale=False):
    image_src = cv2.imread(image_file)
    if gray_scale:
        image_src = cv2.cvtColor(image_src, cv2.COLOR_BGR2GRAY)
    else:
        image_src = cv2.cvtColor(image_src, cv2.COLOR_BGR2RGB)
    return image_src
The above function reads the image either in grayscale or RGB and returns the image matrix.
Code Implementation with Library
We will use cv2.rectangle() method. But for better visualization, we can the following function taking arguments:
start_pos→ To knowing the starting position of the rectangle to draw.length→ Length of the rectangle (absolute value is considered).width→ Width of the rectangle (absolute value is considered).
From the above three arguments, we can obtain pt1 and pt2 points.
thickness→ Thickness of the rectangle.color_name→ Instead of passing theRGBcode, we can extract the (R, G, B) values from thecolor_names_data.jsonfile where I have stored all the possible color names with their (R, G, B) values respectively. The sample of the color data can be viewed below.
{
  "air force blue": {
    "r": 93,
    "g": 138,
    "b": 168,
    "hex": "#5d8aa8"
  },
  "alizarin crimson": {
    "r": 227,
    "g": 38,
    "b": 54,
    "hex": "#e32636"
  },
  "almond": {
    "r": 239,
    "g": 222,
    "b": 205,
    "hex": "#efdecd"
  },
  ...
}
The function works for both colored images and grayscale images. But for grayscale images, a default color Black is considered.
def rectangle_lib(image_file, start_pos, length, width, thickness=3, with_plot=False, gray_scale=False, color_name=0):
    image_src = read_this(image_file=image_file, gray_scale=gray_scale)
    image_main = read_this(image_file=image_file, gray_scale=gray_scale)
    image_shape = image_src.shape

    length = abs(length)
    width = abs(width)

    start_row = start_pos if start_pos >= 0 else 0
    start_column = start_row
    end_row = length + start_row
    end_row = end_row if end_row <= image_shape[0] else image_shape[0]
    end_column = width + start_column
    end_column = end_column if end_column <= image_shape[1] else image_shape[1]

    if gray_scale:
        color_name = (0, 0, 0)
    else:
        with open(file='color_names_data.json', mode='r') as col_json:
            color_db = json.load(fp=col_json)

        color_name = str(color_name).strip().lower()
        colors_list = list(color_db.keys())

        if color_name not in colors_list:
            color_name = (0, 0, 0)
        else:
            color_name = tuple([color_db[color_name][i] for i in 'rgb'])

    # library method
    image_rect = cv2.rectangle(image_src, (start_column, start_row), (end_column, end_row), color_name, thickness)

    if with_plot:
        cmap_val = None if not gray_scale else 'gray'
        fig, (ax1, ax2) = plt.subplots(nrows=1, ncols=2, figsize=(10, 20))

        ax1.axis("off")
        ax1.title.set_text('Original')

        ax2.axis("off")
        ax2.title.set_text("Rectangle")

        ax1.imshow(image_main, cmap=cmap_val)
        ax2.imshow(image_rect, cmap=cmap_val)
        return True
    return image_rect
The above function is way better to implement rather than specifying the point on our own. We can simply mention the three important arguments and based on that the points are determined. Let’s test the function.
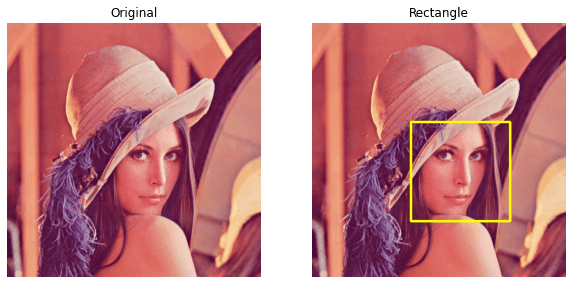
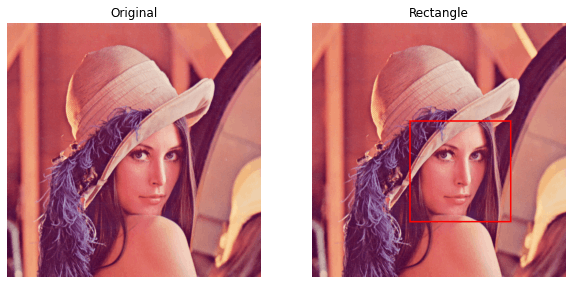
For color image:
rectangle_lib(
    image_file='lena_original.png',
    start_pos=199,
    length=200,
    width=200,
    thickness=3,
    with_plot=True,
    color_name="yellow"
)
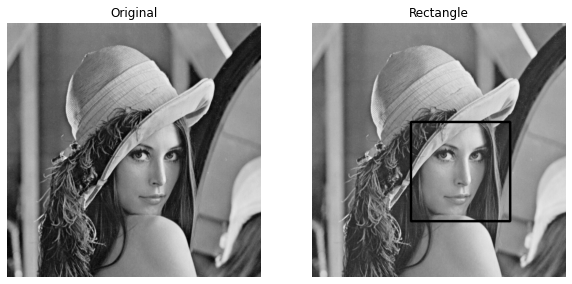
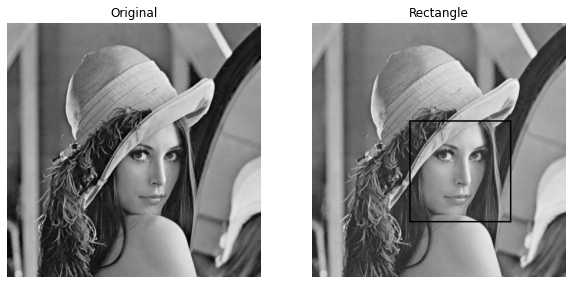
For grayscale image:
rectangle_lib(
    image_file='lena_original.png',
    start_pos=199,
    length=200,
    width=200,
    thickness=3,
    with_plot=True,
    gray_scale=True
)
For thickness (-1), there is a special case in which the whole rectangle area is colored based on the color specified.
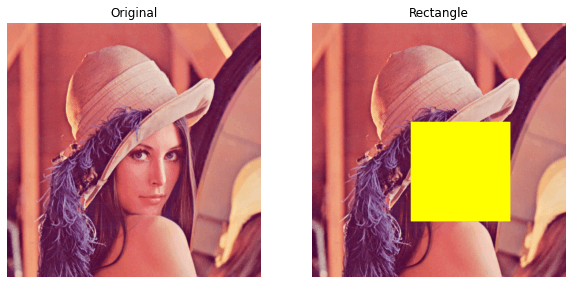
The above cases are implemented using the library method. It is obvious that the library method works for sure. It is time to do something from scratch on our own.
Code Implementation from Scratch
We will use the same arguments that we have used in the above function rectangle_lib(). But the technique which we follow is different. Here, the argument thickness plays an important role alongside start_pos, length, and width.
The logic behind the implementation:
We have to grab the sub-image based on
start_pos,length, andwidth. Basically, we have to crop the image. This cropped image will be the inner portion of the rectangle (Please read this article to know more info).We need to
padthe image matrix with the color value (obtained from the color name). If the image is grayscaled then we will pad with the black color value i.e,0. Otherwise, we willpad3 times after separating theRpixels,Gpixels, andBpixels and finally merging them to form a single image. Basically, we are bordering the cropped image (Please read this article to know more info).Finally, we need to replace this bordered, cropped image in the original image and display the image.
We will use the same color data from the file color_names_data.json for obtaining the color values. Let’s code the logic.
def draw_rectangle(image_file, start_pos, length, width, thickness=3, with_plot=False, gray_scale=False, color_name=0):
    image_src = read_this(image_file=image_file, gray_scale=gray_scale)
    image_main = read_this(image_file=image_file, gray_scale=gray_scale)
    image_shape = image_src.shape

    length = abs(length)
    width = abs(width)
    thickness = -1 if thickness < 0 else thickness

    start_row = start_pos if start_pos >= 0 else 0
    start_column = start_row
    end_row = length + start_row
    end_row = end_row if end_row <= image_shape[0] else image_shape[0]
    end_column = width + start_column
    end_column = end_column if end_column <= image_shape[1] else image_shape[1]

    start_row_grab = start_row - thickness
    end_row_grab = end_row + thickness
    start_column_grab = start_row_grab
    end_column_grab = end_column + thickness

    gso_image = image_src[start_row_grab:end_row_grab, start_column_grab:end_column_grab]
    gsi_image = image_src[start_row:end_row, start_column:end_column]

    if gray_scale:
        color_name = 0
        if thickness != -1:
            inner_image_rect = np.pad(array=gsi_image, pad_width=thickness, mode='constant', constant_values=color_name)
        else:
            max_height, max_width = gso_image.shape
            inner_image_rect = np.zeros(shape=(max_height, max_width))
    else:
        with open(file='color_names_data.json', mode='r') as col_json:
            color_db = json.load(fp=col_json)

        color_name = str(color_name).strip().lower()
        colors_list = list(color_db.keys())

        if color_name not in colors_list:
            r_cons, g_cons, b_cons = (0, 0, 0)
        else:
            r_cons, g_cons, b_cons = [color_db[color_name][i] for i in 'rgb']

        r_inner_image, g_inner_image, b_inner_image = gsi_image[:, :, 0], gsi_image[:, :, 1], gsi_image[:, :, 2]

        if thickness != -1:
            r_inner_rect = np.pad(array=r_inner_image, pad_width=thickness, mode='constant', constant_values=r_cons)
            g_inner_rect = np.pad(array=g_inner_image, pad_width=thickness, mode='constant', constant_values=g_cons)
            b_inner_rect = np.pad(array=b_inner_image, pad_width=thickness, mode='constant', constant_values=b_cons)
            inner_image_rect = np.dstack(tup=(r_inner_rect, g_inner_rect, b_inner_rect))
        else:
            max_height, max_width, _ = gso_image.shape
            r_out_rect = np.full(shape=(max_height, max_width), fill_value=r_cons)
            g_out_rect = np.full(shape=(max_height, max_width), fill_value=g_cons)
            b_out_rect = np.full(shape=(max_height, max_width), fill_value=b_cons)
            inner_image_rect = np.dstack(tup=(r_out_rect, g_out_rect, b_out_rect))

    image_src[start_row_grab:end_row_grab, start_column_grab:end_column_grab] = inner_image_rect
    image_rect = image_src

    if with_plot:
        cmap_val = None if not gray_scale else 'gray'
        fig, (ax1, ax2) = plt.subplots(nrows=1, ncols=2, figsize=(10, 20))

        ax1.axis("off")
        ax1.title.set_text('Original')

        ax2.axis("off")
        ax2.title.set_text("Rectangle")

        ax1.imshow(image_main, cmap=cmap_val)
        ax2.imshow(image_rect, cmap=cmap_val)
        plt.show()
        return True
    return image_rect
Here, we are not dealing with the points to decide the position of the rectangle. We are using the techniques of cropping, bordering, and replacing to achieve the main motive. Let’s test the above function.
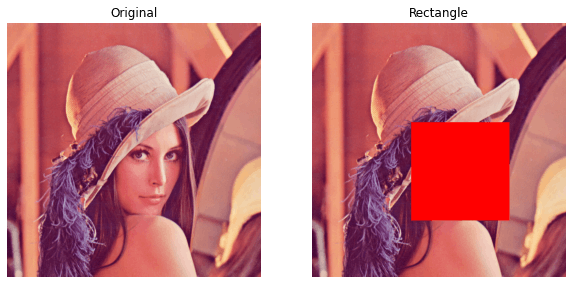
For color image:
draw_rectangle(
    image_file='lena_original.png',
    start_pos=199,
    length=200,
    width=200,
    thickness=3,
    with_plot=True,
    color_name='red'
)
For grayscale image:
draw_rectangle(
    image_file='lena_original.png',
    start_pos=199,
    length=200,
    width=200,
    thickness=3,
    with_plot=True,
    gray_scale=True
)
For thickness (-1), there is a special case in which the whole rectangle area is colored based on the color specified.
This Is It!
We finally got what we wanted. We tried to implement the code from scratch with the help of NumPy matrix operations. We used NumPy methods like:
pad()→ pads the matrix with constant values.zeros()→ We used this for the special case when thethicknessis -1. This is only used when the image is read in grayscale mode.full()→ We used to obtain a matrix of identical values. This is also used when thethicknessis -1 in the case where the image is read in colored mode.
Personally, I learned so much from implementing the method. I hope you find this insightful. You should definitely check out my other articles on the same subject in my profile.
If you liked it, you can buy coffee for me from here.