Indian Railways - Data Visualization App
Indian railways - a way of life.

Photo by eberhard 🖐 grossgasteiger on Unsplash
Introduction
Indian Railways is a statutory agency that manages the entire India's national railway system and is maintained by the Ministry of Railways, Government of India. As of March 31, 2022, it administers the world's fourth-largest national railway system, with a total route length of 67,956 kilometers (42,226 mi). On a daily basis, it runs 13,169 passenger trains both long-distance and suburban routes almost covering 7,325 stations across India.

Indian railways have been one of the go-to options to travel from one to another. This blog is mainly intended to discuss how we can visualize the railways' data as per the station directly on the map.
Data Source
Indian Railways data was collected by Sanjay and Sajjad.
To know more about the difficulties they faced while collecting the data - mainly to maintain the authenticity, you can read it from here.
Source: github.com/datameet/railways
There are three files -
- stations - contains the data of all the stations of India along with the coordinate values and other details. The format of the file is
GeoJSONtype.
{
    "geometry": {
        "type": "Point",
        "coordinates": [75.4516454, 27.2520587]
    },
    "type": "Feature",
    "properties": {
        "state": "Rajasthan",
        "code": "BDHL",
        "name": "Badhal",
        "zone": "NWR",
        "address": "Kishangarh Renwal, Rajasthan"
    }
}
- trains - contains the data of all the train paths (railway routes) along with the coordinate values and other details. The format of the file is
GeoJSONtype.
{
    "geometry": {
        "type": "LineString",
        "coordinates": [
            [72.89173899999999, 19.070320000000002],
            [78.2266994458, 26.0352337224],
            [78.18700399999999, 26.145594],
            [78.18229199999999, 26.216483]
        ]
    },
    "type": "Feature",
    "properties": {
        "third_ac": true,
        "arrival": "15:35:00",
        "from_station_code": "LTT",
        "name": "Mumbai LTT - Gwalior (Weekly) Special",
        "zone": "CR",
        "chair_car": true,
        "first_class": true,
        "duration_m": 45,
        "sleeper": true,
        "from_station_name": "LOKMANYA TILAK TERM",
        "number": "01101",
        "departure": "15:50:00",
        "return_train": "01102",
        "to_station_code": "GWL",
        "second_ac": true,
        "classes": "",
        "to_station_name": "GWALIOR JN",
        "duration_h": 23,
        "type": "Exp",
        "first_ac": true,
        "distance": 1216
    }
}
- schedules - contains the data of all the train schedules along with other details. The format of the file is
JSONtype.
{
    "arrival": "None",
    "day": 1,
    "train_name": "Falaknuma Lingampalli MMTS",
    "station_name": "KACHEGUDA FALAKNUMA",
    "station_code": "FM",
    "id": 302214,
    "train_number": "47154",
    "departure": "07:55:00"
}
In Addition to this, I downloaded the shape file of India that contains the boundaries of the states.
Implementation
import Packages
As always we begin with importing the packages that are essential for this project.
Data Reading
JSONfile reader - all theJSONfile data including theGeoJSONformat can be read using the below function.SHPfile reader - helps to read the shape file data.
Data Preparation
The files stations.json and trains.json need to be converted into shape files and thus the data can be easily manipulated further using the geopandas package.
stations shape file
trains shape file
Indian States Boundaries
In the stations shapefile, there are so many missing values (especially in the state columns. To get the state name, we need to perform spatial join, keeping stations on the left and Indian states' boundaries on the right.
Similarly, in the trains shapefile, there are a few stations that contain multiple states. The following is the list for the same.
MAULA ALI → Telangana, Punjab
NAGARGALI → Maharashtra, Karnataka
INDARGARH → Rajasthan, Madhya Pradesh
ALAI → Rajasthan, Uttrakhand
Jagdishpur → Bihar, Jharkhand
KOMATIPALLI → Telangana, Andhra Pradesh
NAGARI → Andhra Pradesh, Maharashtra
Kashinagar Halt → West Bengal, Odisha
SULGARE → Maharashtra, Chattisgarh
Data Visualization
Now that the data is prepared, we can use Plotly to get an interactive map plot.
Stations
With the above function, we can plot the stations by providing the state_name param.
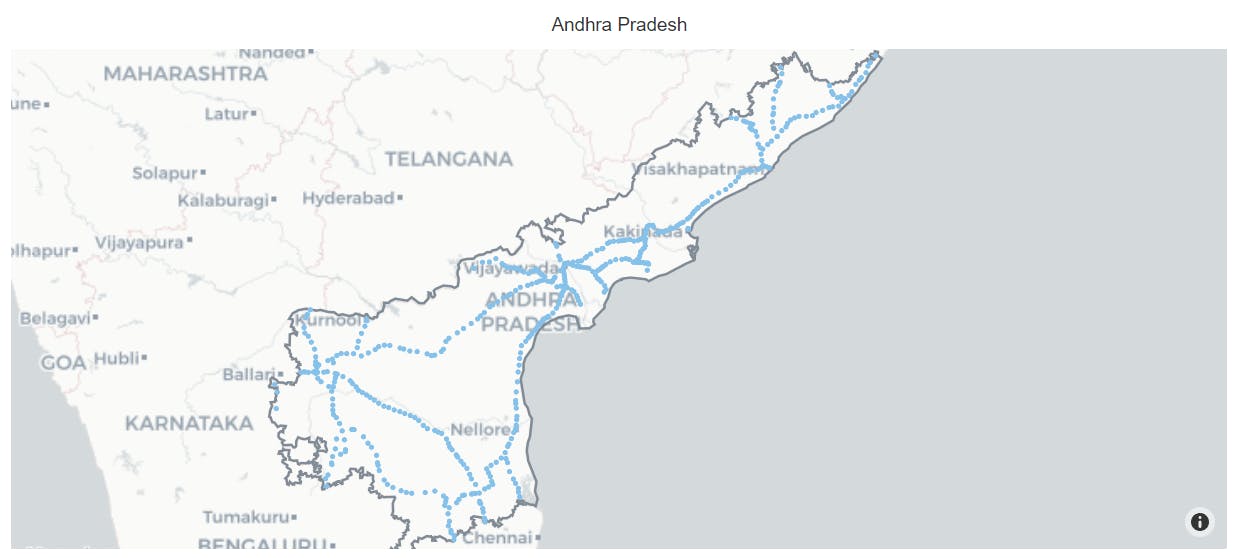
Andhra Pradesh stations
Trains
With the above function, we can plot the train paths by providing the state_name param.
Andhra Pradesh trains
Trains (from station)
With the above function, we can plot the train paths provided from_ station.
Chennai Beach station
App Development
Using all the procedures above and other packages (like dash) that support Plotly figures, we can develop a full-fledged web application.
Since we have two aspects stations and trains, we can create HTML tabs and accordingly display the map.
Stations
Input Layout
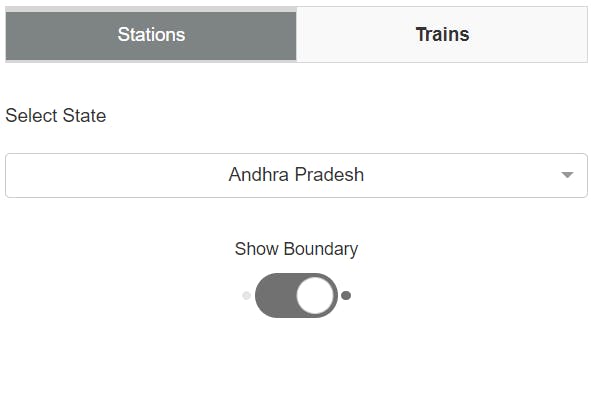
Apart from just having state_name it also has additional inputs such as displaying the boundary of the state.
Output Layout
Trains
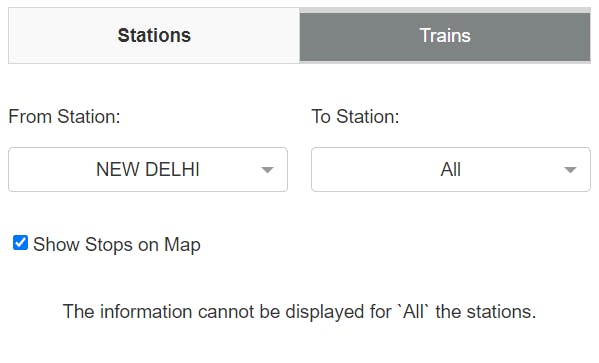
Input Layout
Output Layout
The below plot shows each stop from the from_ station to all the remaining stations.
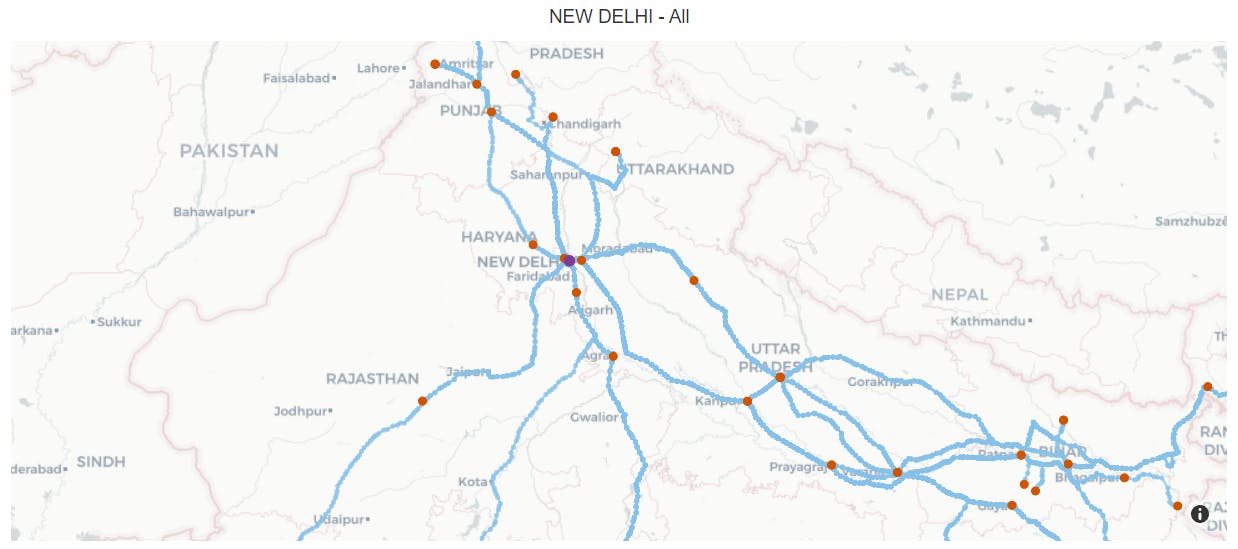
The below plot does not show any stops but all the stations from the from_ station in the form of a network.
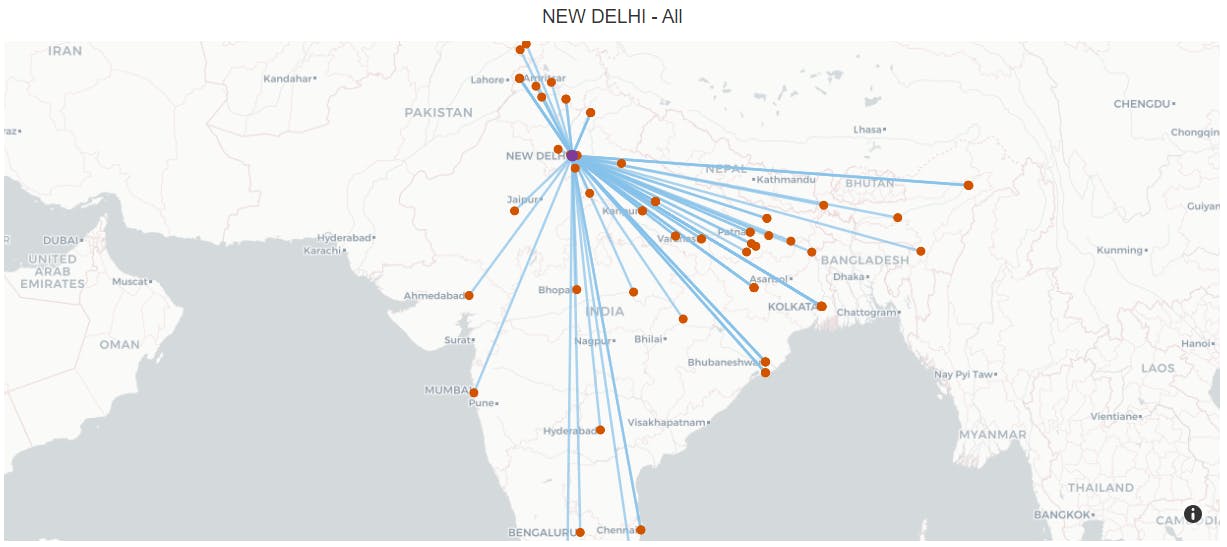
from station to station
If we select a specific to_ station, we get to see additional details of the train like -
Arrival - the time when the train arrives.
Departure - the time when the train departures.
1st Class -
1if the train is 1st class, else0.Time - duration to reach the destination station.
Sleeper -
1if the train is sleeper type class, else0.Distance - the total distance in kilometers.
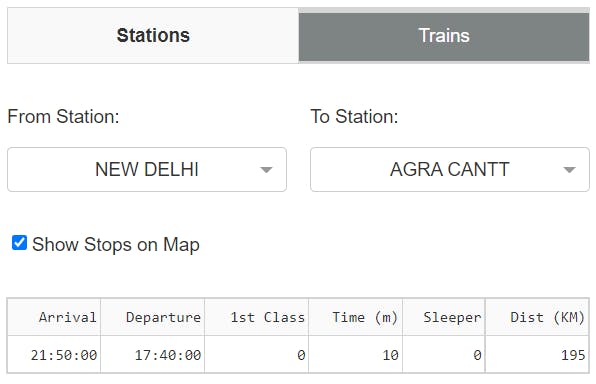
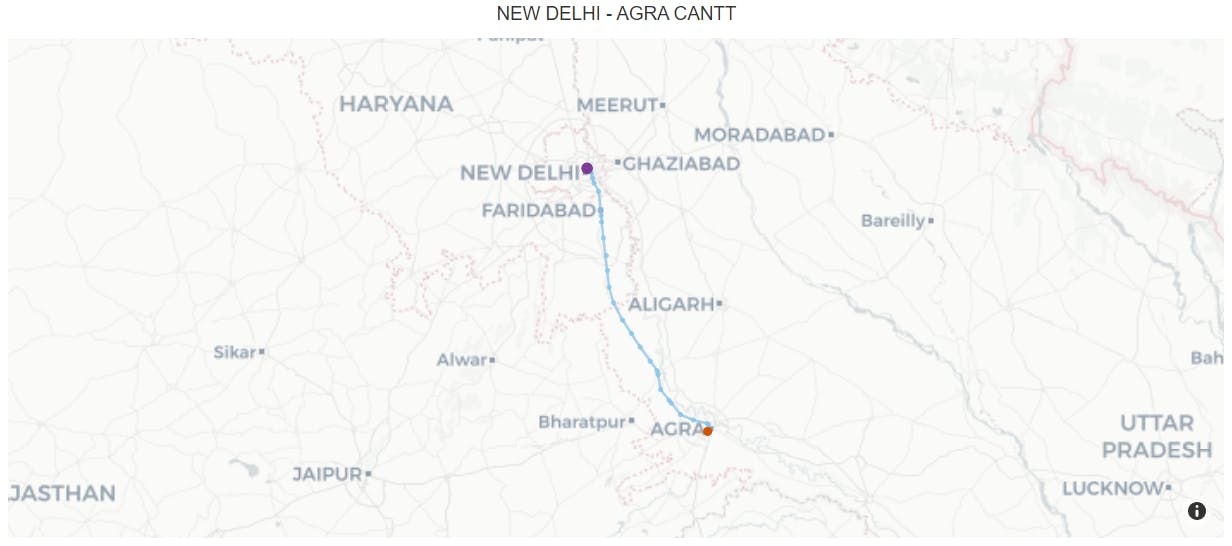
The map for the same is below.
Well, that's it for this article. You can find my work in the below links.
You can also subscribe to my newsletter for such exclusive content. Thanks all.
End