Introduction
When we talk about images, Images are more like matrices where data is stored row-wise and column-wise. Since the image is a replication of a matrix, we can do all sorts of matrix operations on the image.
Credits of Cover Image - Photo by Erwan Hesry on Unsplash
We will use the NumPy module extensively for this project and also for the following projects related to Image Processing.
Matrix Creation
>>> import numpy as np
>>>
>>> mat = np.matrix(
...     [[1, 2, 3, 4, 5],
...      [3, 4, 5, 6, 1]]
... )
>>> mat
matrix([[1, 2, 3, 4, 5],
        [3, 4, 5, 6, 1]])
>>>
>>> mat.shape
(2, 5)
>>>
Transpose Operation
>>> mat.T
matrix([[1, 3],
        [2, 4],
        [3, 5],
        [4, 6],
        [5, 1]])
>>>
Scalar Multiplication
>>> 3 * mat
matrix([[ 3,  6,  9, 12, 15],
        [ 9, 12, 15, 18,  3]])
>>>
Matrix to Image
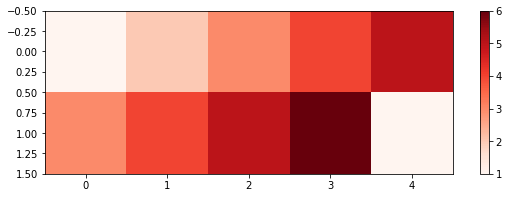
For converting the matrix into an image, we can use the Matplotlib module. The method imshow() is helpful to do the conversion.
>>> from matplotlib import pyplot as plt
>>>
>>> plt.figure(figsize=(10, 3))
>>> image_mat = plt.imshow(mat, cmap='Reds')
>>> plt.colorbar(image_mat)
>>> plt.show()
>>>

Large matrix to Image
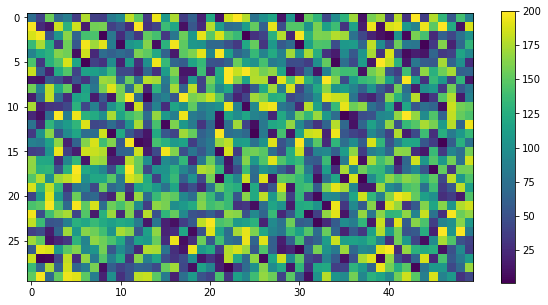
In the above example, we did the conversion for a small matrix. Now we shall try to do the conversion for a large matrix. We will use the Random module to generate random numbers for the matrix.
- There should be 30 rows and 50 columns.
- Each row of the matrix should have 50 numbers in the range of 1 and 200.
We shall use the method randint(a, b) to create a random large matrix.
>>> import random
>>>
>>> big_mat = [
...     [random.randint(1, 200) for i in range(50)]
...     for j in range(30)
... ]
>>>
>>> big_mat = np.matrix(big_mat)
>>>
>>> big_mat
matrix([[ 16, 184, 130, ...,  35, 126, 104],
        [198, 153, 172, ..., 109,  60, 174],
        [ 90, 138, 108, ..., 192, 132, 103],
        ...,
        [172,  83, 158, ..., 154,   4, 109],
        [ 23,   3, 198, ..., 147,  12,  88],
        [ 62, 106,  96, ..., 191,  83, 193]])
>>>
>>> big_mat.shape
(30, 50)
>>>
Let's convert the above large matrix into an image.
>>> plt.figure(figsize=(10, 5))
>>> image_mat = plt.imshow(big_mat, cmap=None)
>>> plt.colorbar(image_mat)
>>> plt.show()

Image to Matrix
To convert an image into a matrix, we need to use the package called opencv-python. With this package, we can read an image into a matrix and perform the matrix operations using the NumPy module.
Installation
pip install opencv-python --user
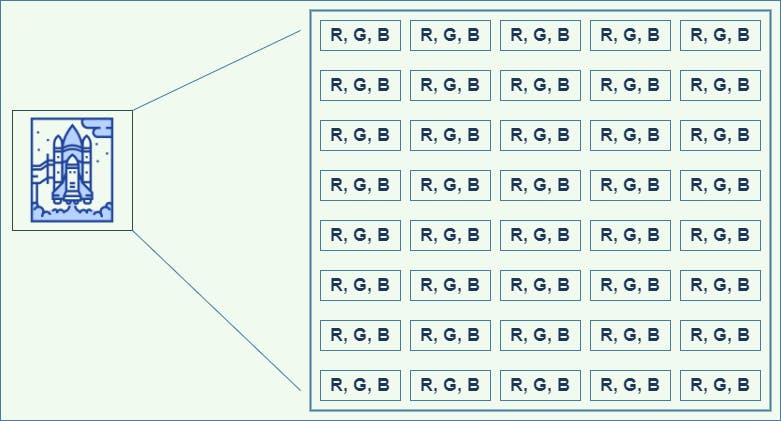
A typical colored image is comprised of pixels that are represented as RGB pixels. A pixel is simply a number in the range of 0 to255 for all R, G, and B.
- R → Red → 0 to 255
- G → Green → 0 to 255
- B → Blue → 0 to 255

We will cv2 (OpenCV) module to read the image in the form of a matrix. The method imread() is used to read the image either in grayscale mode or RGB mode.
import the packages
import numpy as np
import cv2
import json
from matplotlib import pyplot as plt
The image that we will be reading is the original Lenna image. Function to read the image as a matrix.
def read_this(image_file, gray_scale=False):
    image_src = cv2.imread(image_file)
    if gray_scale:
        image_src = cv2.cvtColor(image_src, cv2.COLOR_BGR2GRAY)
    else:
        image_src = cv2.cvtColor(image_src, cv2.COLOR_BGR2RGB)
    return image_src
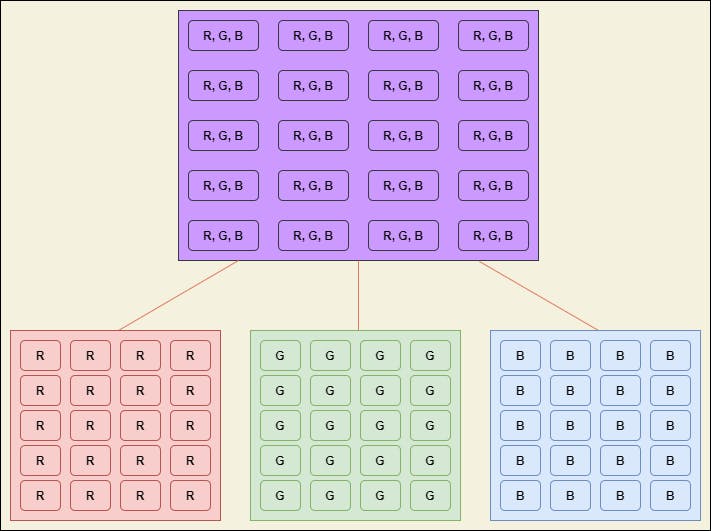
By default, imread() reads the image in BGR (Blue, Green, and Red) format. We shall convert into RGB and hence the above function. Now that we have read the image, we can separate the pixels into 3 distinct matrices separating R, G, and B.

Let's plot the same as we have done for the above examples.
def separate_rgb(image_file, gray_scale=False):
    image_src = read_this(image_file=image_file, gray_scale=gray_scale)
    if not gray_scale:
        r_, g_, b_ = image_src[:, :, 0], image_src[:, :, 1], image_src[:, :, 2]
        return [r_, g_, b_]
    return [image_src]
The above function separates the pixels into 3 distinct matrices.
def plot_rgb_seperated(image_file, with_plot=True, gray_scale=False):
    with_plot = True
    image_src = read_this(image_file=image_file, gray_scale=False)

    separates = separate_rgb(image_file=image_file, gray_scale=gray_scale)
    pixel_matrices = [image_src]
    pixel_matrices.extend(separates)

    cmap_vals = [None, 'Reds', 'Greens', 'Blues'] if not gray_scale else [None, 'gray']
    titles = ['Original', 'Red', 'Green', 'Blues'] if not gray_scale else ['Original', 'Grayscale']
    n_cols = 4 if not gray_scale else 2
    fig_size = (15, 10) if not gray_scale else (10, 20)

    if with_plot:
        fig, axes = plt.subplots(nrows=1, ncols=n_cols, figsize=fig_size)
        for i, ax in zip(range(n_cols), axes):
            ax.axis("off")
            ax.set_title(titles[i])
            ax.imshow(pixel_matrices[i], cmap=cmap_vals[i])
        return True
    return False
The above function plots the matrices along with the original matrix. Let's test the function.
For color image:
plot_rgb_seperated(image_file='lena_original.png')

For grayscale image:
plot_rgb_seperated(image_file='lena_original.png', gray_scale=True)

END
That is it for this article. We have learned how to convert the matrix into an image and vice-versa.